Multiple Choice
Figure 19-2
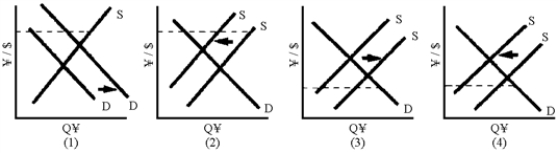
-Of the graphs in Figure 19-2, which one shows Japan practicing "dirty" floating to keep an undervalued currency?
A) 1
B) 2
C) 3
D) 4
Correct Answer:

Verified
Correct Answer:
Verified
Related Questions
Q42: The term "dirty float" is used to
Q43: One method for a deficit country to
Q44: On May 12, 2011, the U.S.dollar was
Q45: Balance of payments deficits arise whenever the
Q46: Prices of European goods are rising faster
Q49: When a country decreases the official value
Q50: Lately, the Chinese authorities seem to be
Q51: When the dollar buys less foreign currency,
Q52: Speculators play an important role in a
Q92: If the quantity of euro demanded were