Multiple Choice
Figure 34-3
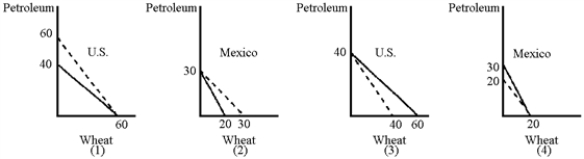
-In Figure 34-3, the solid lines represent the respective production possibilities curves for the United States and Mexico.Which graphs show the correct consumption possibilities curves (dashed lines) after an agreement is reached to trade 1 unit of wheat for 1 unit of petroleum?
A) (1) and (4)
B) (1) and (2)
C) (2) and (3)
D) (3) and (4)
Correct Answer:

Verified
Correct Answer:
Verified
Q112: Japan and China produce guns and rice.The
Q113: The United States can produce 1,000 shoes
Q114: <img src="https://d2lvgg3v3hfg70.cloudfront.net/TB8592/.jpg" alt=" -From Table 34-1,
Q115: How can tariffs lead to a situation
Q116: According to William Safire, "helpfulism" is basically
Q118: What is mercantilism? What are the draw
Q119: A tariff is<br>A)a tax on imports.<br>B)a tax
Q120: A quota sets the maximum amount of
Q121: If one country has an absolute advantage
Q122: <img src="https://d2lvgg3v3hfg70.cloudfront.net/TB8592/.jpg" alt=" -From Table 34-1,