menu-iconExamlexExamLexServices

Discover

Ask a Question
  1. All Topics
  2. Topic
    Business
  3. Study Set
    Economics Principles and Policy Study Set 2
  4. Exam
    Exam 33: The Trade-Off Between Inflation and Unemployment
  5. Question
    Figure 33-3 ​
Solved

Figure 33-3 ​

Question 119

Question 119

Multiple Choice

Figure 33-3
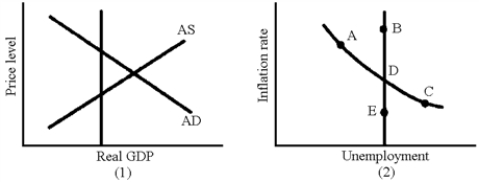
​ Figure 33-3 ​   -Given the situation in graph (1)  in Figure 33-3, what can be expected to change in graph (1)  when the economy's self-correcting mechanism operates? A) Aggregate demand increases. B) Aggregate demand decreases. C) Aggregate supply increases. D) Aggregate supply decreases.
-Given the situation in graph (1) in Figure 33-3, what can be expected to change in graph (1) when the economy's self-correcting mechanism operates?


A) Aggregate demand increases.
B) Aggregate demand decreases.
C) Aggregate supply increases.
D) Aggregate supply decreases.

Correct Answer:

verifed

Verified

Unlock this answer now
Get Access to more Verified Answers free of charge

Related Questions

Q114: Based on the evidence, most economists believe

Q115: If expectations are "rational," can the Fed

Q116: In the 1990s, the United States benefited

Q117: Figure 33-8<br>​ <img src="https://d2lvgg3v3hfg70.cloudfront.net/TB8592/.jpg" alt="Figure 33-8 ​

Q118: Demand-side inflation is usually accompanied by increasing

Q120: According to the Phillips curve, in the

Q121: A vertical long-run Phillips curve is a

Q122: A movement from an upper point to

Q123: Most economists think that, in the short

Q124: The short-run aggregate supply curve is vertical

Examlex

ExamLex

About UsContact UsPerks CenterHomeschoolingTest Prep

Work With Us

Campus RepresentativeInfluencers

Links

FaqPricingChrome Extension

Download The App

Get App StoreGet Google Play

Policies

Privacy PolicyTerms of ServiceHonor CodeCommunity Guidelines

Scan To Download

qr-code

Copyright © (2025) ExamLex LLC.

Privacy PolicyTerms Of ServiceHonor CodeCommunity Guidelines