Multiple Choice
Figure 33-4
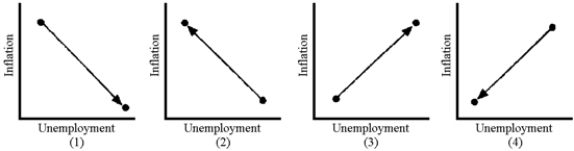
-Which panel in Figure 33-4 shows what happened in 2007-2009?
A) 1
B) 2
C) 3
D) 4
Correct Answer:

Verified
Correct Answer:
Verified
Related Questions
Q27: The unemployment rate for the U.S.economy in
Q28: If employees and employers always accurately predict
Q29: Figure 33-8<br> <img src="https://d2lvgg3v3hfg70.cloudfront.net/TB8592/.jpg" alt="Figure 33-8
Q30: Which of the following is most likely
Q31: The cost of reducing unemployment more rapidly
Q33: If business fluctuations are from demand-side forces,<br>A)monetary
Q34: In what way do policymakers have to
Q35: An example of indexing is a "cost
Q36: If policymakers do nothing in response to
Q37: If expectations are rational, forecasting errors are