Multiple Choice
Figure 33-5
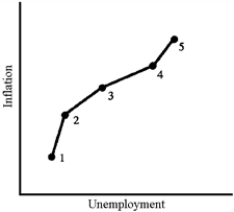
-The data illustrated in Figure 33-5 would be most representative of which of the following decades?
A) The 1960s
B) The 1970s
C) The 1980s
D) The 1990s
Correct Answer:

Verified
Correct Answer:
Verified
Related Questions
Q100: What reasons would economists give for an
Q101: Which of the following is most likely
Q102: In the 1960s and early 1970s, many
Q103: If fluctuations in economic activity emanate from
Q104: Fighting inflation by slowing the growth of
Q106: When inflation comes from the supply side,
Q107: The economy's self-correcting mechanism ensures that neither
Q108: If the fluctuations in the economy's real
Q109: If workers can see inflation coming, and
Q110: Rational expectations are the theory according to