Multiple Choice
Figure 33-8
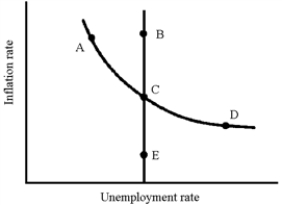
-In Figure 33-8, which of the following movements reflects the Fed's anti-inflationary policy of the early 1980s and the following market adjustment?
A) A to B to C
B) E to A to B
C) C to D to E
D) D to E to C
Correct Answer:

Verified
Correct Answer:
Verified
Q183: Figure 33-3<br> <img src="https://d2lvgg3v3hfg70.cloudfront.net/TB8592/.jpg" alt="Figure 33-3
Q184: Figure 33-7<br> <img src="https://d2lvgg3v3hfg70.cloudfront.net/TB8592/.jpg" alt="Figure 33-7
Q185: If AS increases at a faster rate
Q186: The rapid advance in computer technology is
Q187: Figure 33-7<br> <img src="https://d2lvgg3v3hfg70.cloudfront.net/TB8592/.jpg" alt="Figure 33-7
Q189: Figure 33-8<br> <img src="https://d2lvgg3v3hfg70.cloudfront.net/TB8592/.jpg" alt="Figure 33-8
Q190: If the favorable supply shocks of the
Q191: Many economists think that, in the long
Q192: One explanation for the increase in the
Q193: What is the effect of supply-side inflation