Multiple Choice
Figure 11-2
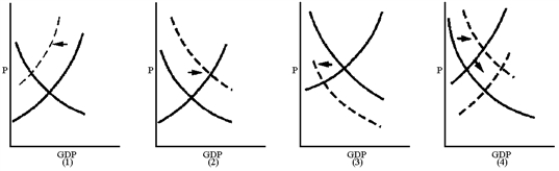
-Which graph in Figure 11-2 best reflects a Keynesian's view of the impact of raising taxes on saving?
A) 1
B) 2
C) 3
D) 4
Correct Answer:

Verified
Correct Answer:
Verified
Related Questions
Q94: Which of the following observations is true?<br>A)Tax
Q95: As a general rule, when an income
Q96: Taxes are the difference between<br>A)GDP and net
Q97: If President Obama wanted to decrease aggregate
Q98: A proponent of supply-side economics would advocate<br>A)reducing
Q100: Recessionary gaps can be cured by raising
Q101: Most of the taxes collected by governments
Q102: When the government taxes and spends, each
Q103: To close a recessionary gap, Keynesian theory
Q104: Figure 11-2<br> <img src="https://d2lvgg3v3hfg70.cloudfront.net/TB8592/.jpg" alt="Figure 11-2