Multiple Choice
Figure 11-3
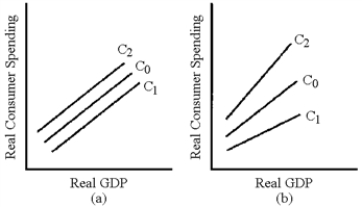
-In Figure 11-3, which line represents the change in the consumption schedule caused by a cut in fixed taxes?
A) C1 in graph (a)
B) C2 in graph (a)
C) C1 in graph (b)
D) C2 in graph (b)
Correct Answer:

Verified
Correct Answer:
Verified
Related Questions
Q153: To eliminate an inflationary gap, the aggregate
Q154: Congress is debating whether to raise taxes
Q155: If a "liberal" wanted to increase aggregate
Q156: The president wishes not only to increase
Q157: Personal income taxes and corporate income taxes
Q159: A budget deficit occurs when government expenditures
Q160: Supply-side tax cuts are more likely to
Q161: An increase or decrease in taxes will
Q162: The personal income tax varies as GDP
Q163: An income tax reduces the size of