Multiple Choice
Figure 11-3
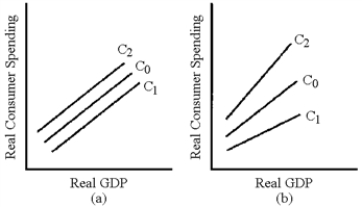
-In Figure 11-3, which line represents the change in the consumption schedule caused by a cut in the personal income tax as advocated by President George W.Bush in 2001?
A) C1 in graph (a)
B) C2 in graph (a)
C) C1 in graph (b)
D) C2 in graph (b)
Correct Answer:

Verified
Correct Answer:
Verified
Q103: To close a recessionary gap, Keynesian theory
Q104: Figure 11-2<br> <img src="https://d2lvgg3v3hfg70.cloudfront.net/TB8592/.jpg" alt="Figure 11-2
Q105: Transfer payments represent income that is not
Q106: When income taxes are included in the
Q107: Figure 11-2<br> <img src="https://d2lvgg3v3hfg70.cloudfront.net/TB8592/.jpg" alt="Figure 11-2
Q109: Contractionary fiscal policy may have some undesirable
Q110: To eliminate an inflationary gap, the expenditure
Q111: Liberals tend to favor increasing taxes as
Q112: One of the three reasons as to
Q113: In 2009, the U.S.economy was experiencing a(n)<br>A)recessionary