Multiple Choice
Figure 10-1
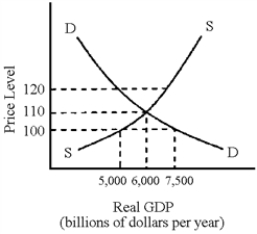
-In Figure 10-1, what is the equilibrium level of real GDP and equilibrium price?
A) $6,000 billion real GDP and price level of 110
B) $5,000 billion real GDP and price level of 120
C) $5,000 billion real GDP and price level of 110
D) $7,500 billion real GDP and price level of 100
Correct Answer:

Verified
Correct Answer:
Verified
Q210: As the U.S.labor force grows and the
Q211: Figure 10-4<br> <img src="https://d2lvgg3v3hfg70.cloudfront.net/TB8592/.jpg" alt="Figure 10-4
Q212: Using the aggregate demand/aggregate supply model, explain
Q213: Discuss some of the arguments that help
Q214: If the data show that periods of
Q216: Figure 10-5 <img src="https://d2lvgg3v3hfg70.cloudfront.net/TB8592/.jpg" alt="Figure 10-5
Q217: What would be the likely result of
Q218: The aggregate supply curve shows how much
Q219: Figure 10-2<br> <img src="https://d2lvgg3v3hfg70.cloudfront.net/TB8592/.jpg" alt="Figure 10-2
Q220: The major cost of production in the