Multiple Choice
Figure 10-4
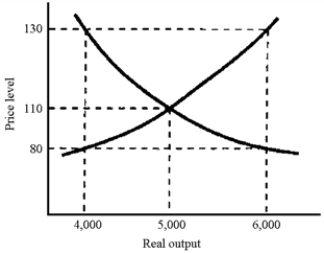
-In Figure 10-4, if full employment occurs at 5,000 and the price level is currently 130, then we can expect the
A) aggregate supply curve to shift to the left until a new equilibrium is established at an output level of 4,000.
B) aggregate demand curve to shift to the right until a new equilibrium is established at an output level of 6,000.
C) price level to fall to 110.
D) aggregate demand to shift to the left and aggregate supply to shift to the right until the price level reaches 130.
Correct Answer:

Verified
Correct Answer:
Verified
Q200: The fact that severe fluctuations in inflation
Q201: Figure 10-7<br> <img src="https://d2lvgg3v3hfg70.cloudfront.net/TB8592/.jpg" alt="Figure 10-7
Q202: What is the principal reason that economists
Q203: Increases in the availability of natural resources
Q204: At levels of output close to full
Q206: The reason why inflation reduces the value
Q207: Which of the following is evidence of
Q208: A statement issued by the president's economic
Q209: A decrease in the price of resources
Q210: As the U.S.labor force grows and the