Multiple Choice
Figure 10-5 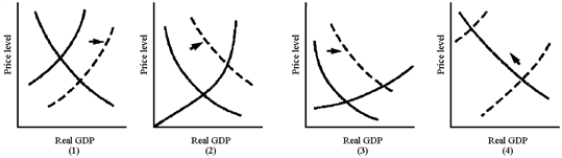
-In Figure 10-5, which graph best illustrates the situation of an economy reacting to an inflationary gap through an increase in wage levels?
A) (1)
B) (2)
C) (3)
D) -(4)
Correct Answer:

Verified
Correct Answer:
Verified
Q125: Stagflation exists when prices rise and output
Q126: Figure 10-2<br> <img src="https://d2lvgg3v3hfg70.cloudfront.net/TB8592/.jpg" alt="Figure 10-2
Q127: Figure 10-2<br> <img src="https://d2lvgg3v3hfg70.cloudfront.net/TB8592/.jpg" alt="Figure 10-2
Q128: When inflation occurs, consumers<br>A)realize gains in their
Q129: Describe the main explanations for the downward
Q131: The slope of the aggregate supply curve
Q132: The existence of an inflationary gap would
Q133: Figure 10-5 <img src="https://d2lvgg3v3hfg70.cloudfront.net/TB8592/.jpg" alt="Figure 10-5
Q134: An inflationary gap exists when consumers<br>A)are saving
Q135: A consequence of an inflationary gap is