Multiple Choice
Figure 10-6
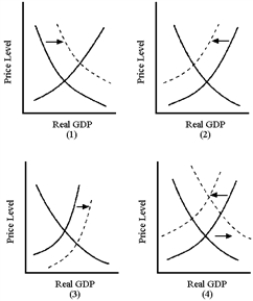
-In Figure 10-6, which graph best illustrates the effect of the beginning of the Iraq war in 2003?
A) (1)
B) (2)
C) (3)
D) (4)
Correct Answer:

Verified
Correct Answer:
Verified
Related Questions
Q41: Which of the following events shifts the
Q42: As the multiplier process is working on
Q43: In 1986, OPEC countries increased their production
Q44: Holding wages constant, any increase in productivity
Q45: In response to the demands of environmentalists,
Q47: One complication that tends to prolong recessionary
Q48: The 2002-2008 OPEC price increases caused by
Q49: If aggregate demand is $2,000 billion and
Q50: Which of the following would cause stagflation?<br>A)Aggregate
Q51: How is it possible for the economy