Multiple Choice
Figure 10-7
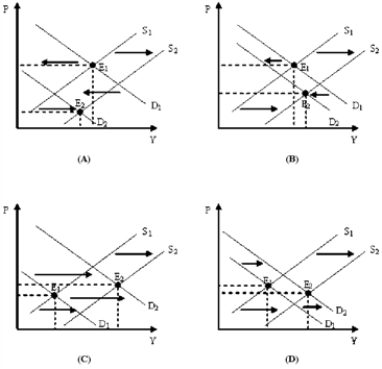
-Which of the diagrams in Figure 10-7 represents a period of economic growth and inflation?
A) (A)
B) (B)
C) (C)
D) (D)
Correct Answer:

Verified
Correct Answer:
Verified
Related Questions
Q77: An increase in the nominal wage shifts
Q78: A period of stagflation can be considered
Q79: An inflationary gap will occur when<br>A)real GDP
Q80: If short-run equilibrium GDP is above potential
Q81: What is the usual response of firm
Q83: Figure 10-5 <img src="https://d2lvgg3v3hfg70.cloudfront.net/TB8592/.jpg" alt="Figure 10-5
Q84: The only factor that can cause movement
Q85: If profit per unit equals (price −
Q86: The typical results of an adverse supply
Q87: For most firms in the economy, the