Multiple Choice
Figure 10-7
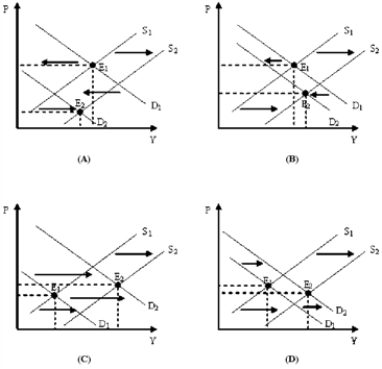
-Which of the diagrams in Figure 10-7 represents a decrease in consumer spending combined with a positive supply shock?
A) (A) and (B)
B) (C) and (D)
C) (A) and (C)
D) (B) and (D)
Correct Answer:

Verified
Correct Answer:
Verified
Q23: The aggregate supply curve slopes upward because
Q24: Figure 10-9<br> <img src="https://d2lvgg3v3hfg70.cloudfront.net/TB8592/.jpg" alt="Figure 10-9
Q25: Suppose we observe an economy experience an
Q26: When economists refer to the economy's self-correcting
Q27: Equilibrium GDP in excess of potential GDP
Q29: When the price level is considered, the
Q30: Figure 10-9<br> <img src="https://d2lvgg3v3hfg70.cloudfront.net/TB8592/.jpg" alt="Figure 10-9
Q31: When the inflationary gap is finally eliminated,
Q32: Improvements in productivity shift the aggregate supply
Q33: Recessionary gap is the amount by which