Multiple Choice
Figure 10-7
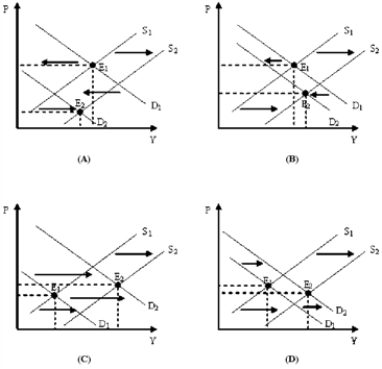
-Which of the diagrams in Figure 10-7 shows an economic expansion caused primarily by a change in aggregate demand?
A) (A)
B) (B)
C) (C)
D) (D)
Correct Answer:

Verified
Correct Answer:
Verified
Q191: Many economists describe the 2007-2009 period in
Q192: Which of the following situations would cause
Q193: Why is it possible that the economy
Q194: A company succumbs to a wage increase
Q195: The aggregate supply curve is drawn with<br>A)the
Q197: The federal government increases spending by $50
Q198: Figure 10-7<br> <img src="https://d2lvgg3v3hfg70.cloudfront.net/TB8592/.jpg" alt="Figure 10-7
Q199: An inflationary gap exists when consumers and
Q200: The fact that severe fluctuations in inflation
Q201: Figure 10-7<br> <img src="https://d2lvgg3v3hfg70.cloudfront.net/TB8592/.jpg" alt="Figure 10-7