menu-iconExamlexExamLexServices

Discover

Ask a Question
  1. All Topics
  2. Topic
    Business
  3. Study Set
    Economics Principles and Policy Study Set 2
  4. Exam
    Exam 26: Bringing in the Supply Side: Unemployment and Inflation
  5. Question
    Figure 10-9 ​
Solved

Figure 10-9 ​

Question 165

Question 165

Multiple Choice

Figure 10-9
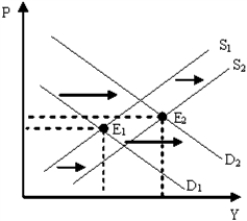
​ Figure 10-9 ​   -Figure 10-9 describes which of the following periods in the United States? A) 1930s B) 1973-1975 C) late 1990s D) 2007-2009
-Figure 10-9 describes which of the following periods in the United States?


A) 1930s
B) 1973-1975
C) late 1990s
D) 2007-2009

Correct Answer:

verifed

Verified

Unlock this answer now
Get Access to more Verified Answers free of charge

Related Questions

Q160: In our modern economy, the adjustment process

Q161: Aggregate supply can be thought of as<br>A)a

Q162: Wages are the major element of cost

Q163: The concept of aggregate supply refers to

Q164: The post-World War II record shows that

Q166: Stagflation may follow an inflationary boom.

Q167: A common error of business managers is

Q168: During 2008-2010, the U.S.economy showed signs of

Q169: If resource prices are fixed and the

Q170: To calculate a firm's per unit of

Examlex

ExamLex

About UsContact UsPerks CenterHomeschoolingTest Prep

Work With Us

Campus RepresentativeInfluencers

Links

FaqPricingChrome Extension

Download The App

Get App StoreGet Google Play

Policies

Privacy PolicyTerms of ServiceHonor CodeCommunity Guidelines

Scan To Download

qr-code

Copyright © (2025) ExamLex LLC.

Privacy PolicyTerms Of ServiceHonor CodeCommunity Guidelines