Multiple Choice
Figure 9-1
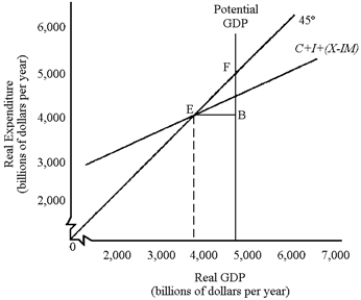
-In Figure 9-1,
A) the 45° line represents all points where spending equals output.
B) to the left of equilibrium GDP, inventories will rise.
C) to the right of equilibrium GDP, inventories will fall.
D) the level of equilibrium GDP equals potential GDP.
Correct Answer:

Verified
Correct Answer:
Verified
Q110: Figure 9-1<br> <img src="https://d2lvgg3v3hfg70.cloudfront.net/TB8592/.jpg" alt="Figure 9-1
Q111: Describe the role of business inventory change
Q112: A decrease in autonomous consumption would have
Q113: High unemployment and high rates of inflation
Q114: Figure 9-1<br> <img src="https://d2lvgg3v3hfg70.cloudfront.net/TB8592/.jpg" alt="Figure 9-1
Q116: When constructing a basic macroeconomic model, several
Q117: Two variables that affect the slope of
Q118: Investment spending might be larger when GDP
Q119: If an increase in investment of $100
Q120: The basic idea behind the multiplier is