Multiple Choice
Figure 9-3
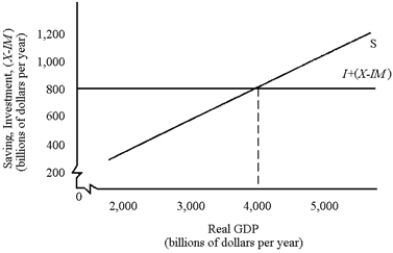
-In Figure 9-3, saving at equilibrium GDP is
A) $1,200 billion.
B) $1,000 billion.
C) $800 billion.
D) $600 billion.
E) $400 billion.
Correct Answer:

Verified
Correct Answer:
Verified
Related Questions
Q169: In the real world, the actual multiplier
Q170: According to Baumol and Blinder, from the
Q171: An expenditure schedule that lies below the
Q172: The multiplier principle explains how<br>A)any change in
Q173: If total spending is less than the
Q175: A recessionary gap exists when the equilibrium
Q176: If the expenditure schedule must be shifted
Q177: Figure 9-4<br> <img src="https://d2lvgg3v3hfg70.cloudfront.net/TB8592/.jpg" alt="Figure 9-4
Q178: When net exports increase,<br>A)the expenditures schedule increases.<br>B)the
Q179: One of the main conclusions of Keynes