Multiple Choice
Figure 8-1
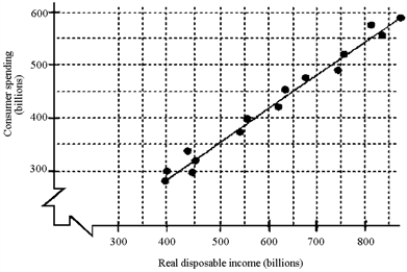
-Given the scatter diagram in Figure 8-1, if real disposable income is $600 billion and asset wealth increases by $100 billion, how much will consumers spend?
A) $550 billion
B) $450 billion
C) $600 billion
D) Cannot be determined
Correct Answer:

Verified
Correct Answer:
Verified
Q60: Which of the following would be removed
Q61: New residential housing is placed under consumer
Q62: Which of the following would is included
Q63: When GDP is calculated as the final
Q64: Figure 8-1<br> <img src="https://d2lvgg3v3hfg70.cloudfront.net/TB8592/.jpg" alt="Figure 8-1
Q66: The marginal propensity to consume is calculated
Q67: Discuss the major determinants of net exports.
Q68: Whirlpool Corporation buys steel in sheets to
Q69: An increase in stock prices will be
Q70: Why do permanent tax cuts have a