Multiple Choice
Figure 8-1
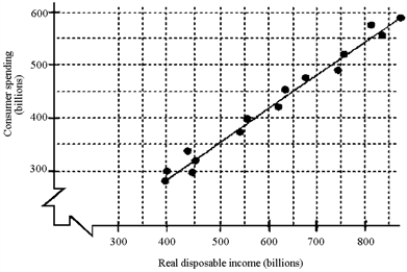
-Based on the scatter diagram in Figure 8-1, if real disposable income is $800 billion, the consumption spending would be approximately
A) $800 billion.
B) $650 billion.
C) $540 billion.
D) $420 billion.
Correct Answer:

Verified
Correct Answer:
Verified
Related Questions
Q17: The difference between Gross National Product and
Q18: Suppose the stock market rises, causing a
Q19: If a U.S.citizen buys a car produced
Q20: Figure 8-1<br> <img src="https://d2lvgg3v3hfg70.cloudfront.net/TB8592/.jpg" alt="Figure 8-1
Q21: The tax cut of 2009 had little
Q23: The largest component of aggregate demand is<br>A)investment
Q24: A scatter diagram could help a policy
Q25: Which of the following will most likely
Q26: If Kobe, an NBA star athlete, earns
Q27: Which of the following factors would cause