Multiple Choice
Figure 8-2
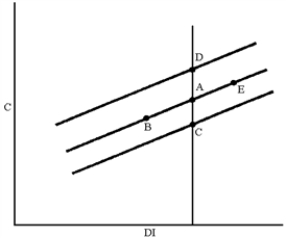
-In Figure 8-2, which of the following moves can be explained by a decrease in the price level?
A) A to B
B) A to C
C) A to D
D) A to E
Correct Answer:

Verified
Correct Answer:
Verified
Related Questions
Q120: Which of the following is an example
Q121: If income in Austria decreases by 30
Q122: In 1963, government economists assumed that the
Q123: Money-fixed assets include government bonds, corporate bonds,
Q124: Consumption functions would shift downward if<br>A)disposable incomes
Q126: Which of the following observations concerning GDP
Q127: Figure 8-2<br> <img src="https://d2lvgg3v3hfg70.cloudfront.net/TB8592/.jpg" alt="Figure 8-2
Q128: Which of the following is not part
Q129: When saving leaks out of the circular
Q130: Aggregate demand is the total demand for<br>A)all