menu-iconExamlexExamLexServices

Discover

Ask a Question
  1. All Topics
  2. Topic
    Business
  3. Study Set
    Economics Principles and Policy Study Set 2
  4. Exam
    Exam 21: An Introduction to Macroeconomics
  5. Question
    Figure 5-1 ​
Solved

Figure 5-1 ​

Question 146

Question 146

Multiple Choice

Figure 5-1
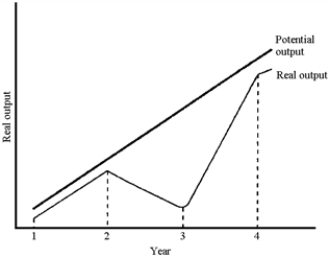
​ Figure 5-1 ​   -Figure 5-1 plots potential and real output for a hypothetical economy.Based on this graph, the recession occurred A) between years 1 and 2. B) between years 2 and 3. C) between years 3 and 4. D) after year 4.
-Figure 5-1 plots potential and real output for a hypothetical economy.Based on this graph, the recession occurred


A) between years 1 and 2.
B) between years 2 and 3.
C) between years 3 and 4.
D) after year 4.

Correct Answer:

verifed

Verified

Unlock this answer now
Get Access to more Verified Answers free of charge

Related Questions

Q141: What are intermediate goods? Why do economists

Q142: Aggregate demand and supply curves have been

Q143: Technological change, such as the information technology

Q144: Growth in GDP systematically understates the growth

Q145: How does the calculation of GDP include

Q147: In 1981, the Reagan administration employed a

Q148: Macroeconomics is best described as a study

Q149: In contrast to the post-World War II

Q150: What is an aggregate? How is it

Q151: Gross domestic product is a dollar measure

Examlex

ExamLex

About UsContact UsPerks CenterHomeschoolingTest Prep

Work With Us

Campus RepresentativeInfluencers

Links

FaqPricingChrome Extension

Download The App

Get App StoreGet Google Play

Policies

Privacy PolicyTerms of ServiceHonor CodeCommunity Guidelines

Scan To Download

qr-code

Copyright © (2025) ExamLex LLC.

Privacy PolicyTerms Of ServiceHonor CodeCommunity Guidelines