Multiple Choice
Figure 18-1 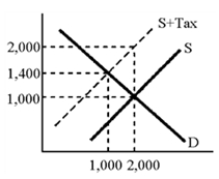
-According to the graph in Figure 18-1, the increase in the amount that consumers pay as a result of the tax is
A) 1,000.00
B) 600
C) 400
D) indeterminate.
Correct Answer:

Verified
Correct Answer:
Verified
Related Questions
Q2: In England, the Thatcher government substituted a
Q3: The allocation of tax burden<br>A)is the total
Q4: Taxes on sales of liquor, tobacco, and
Q5: An excise tax is<br>A)levied on accounting profits
Q6: The second largest source of revenue for
Q8: The courts in some states have declared
Q9: Describe the U.S.Social Security system and explain
Q10: State and local governments receive money from
Q11: If the supply of a good is
Q12: How is state and local government funded