Multiple Choice
Figure 18-1 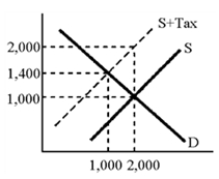
-According to the graph in Figure 18-1, tax collections will be which of the following?
A) 14 million
B) 1.4 million
C) 12 million
D) 1 million
Correct Answer:

Verified
Correct Answer:
Verified
Related Questions
Q203: From the passage of the 16th amendment
Q204: The share of GDP taken by taxes
Q205: Compared to other countries, the U.S.federal government
Q206: Which is not an effect of tax
Q207: The share of GDP taken by taxes
Q209: Social Security payroll taxes are examples of<br>A)progressive
Q210: Sales taxes, property taxes, and value-added taxes
Q211: Explain why some argue that income tax
Q212: Officially, the payroll tax is referred to
Q213: Who bears the burden of an excise