Multiple Choice
Figure 13-2
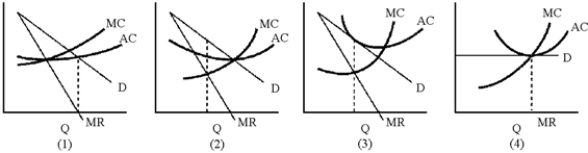
-In Figure 13-2, which of the graphs represents a firm that is a sales revenue maximizer?
A) 1
B) 2
C) 3
D) 4
Correct Answer:

Verified
Correct Answer:
Verified
Related Questions
Q56: Average cost is higher with a monopolistically
Q57: An oligopoly is a market in which
Q58: All players have dominant strategies.
Q59: Economic theory of market forms between pure
Q60: Which of the following best expresses the
Q62: Game theory is based on the idea
Q63: Oligopolists almost always cooperate in making price
Q64: A duopoly is<br>A)a cartel in which all
Q65: Suppose that two drug manufacturers represent the
Q66: The key difference between monopolistic competition and