Multiple Choice
Figure 13-3
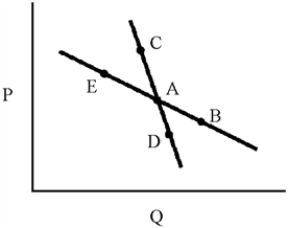
-In Figure 13-3, demand curve CAD represents a market in which oligopolists will match the price changes of rivals and demand curve EAB represents a market in which oligopolists will ignore the price changes of rivals.According to the kinked demand model, the relevant demand curve will be
A) demand curve CAB.
B) demand curve CAD.
C) demand curve EAD.
D) demand curve EAB.
Correct Answer:

Verified
Correct Answer:
Verified
Q115: Suppose that two drug manufacturers represent the
Q116: The demand curve for a monopolistic competitor
Q117: A Nash equilibrium is<br>A)the same as a
Q118: Cartels usually succumb to divisive forces caused
Q119: Monopolistically competitive markets and monopoly market have
Q121: Monopolistic competition is characterized by<br>A)one firm selling
Q122: In the long run, zero economic profit
Q123: Economists tend to be concerned about entry
Q124: If the firms in a market reach
Q125: Figure 13-3<br> <img src="https://d2lvgg3v3hfg70.cloudfront.net/TB8592/.jpg" alt="Figure 13-3