Multiple Choice
Figure 10-1
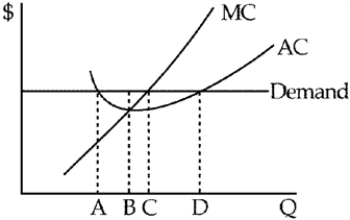
-If the profit-maximizing firm depicted in Figure 10-1 is perfectly competitive, how much output should it produce?
A) A
B) B
C) C
D) D
Correct Answer:

Verified
Correct Answer:
Verified
Q202: What makes the demand curve of the
Q203: Figure 10-1<br> <img src="https://d2lvgg3v3hfg70.cloudfront.net/TB8592/.jpg" alt="Figure 10-1
Q204: In perfectly competitive markets, firms operate where
Q205: One of the following is not a
Q206: Figure 10-4<br> <img src="https://d2lvgg3v3hfg70.cloudfront.net/TB8592/.jpg" alt="Figure 10-4
Q208: The difference between zero accounting profit and
Q209: Which of the following most resembles a
Q210: A price taking firm's short-run supply curve
Q211: In perfectly competitive markets, some buyers do
Q212: Table 10-1 <img src="https://d2lvgg3v3hfg70.cloudfront.net/TB8592/.jpg" alt="Table 10-1