Multiple Choice
Figure 7-1 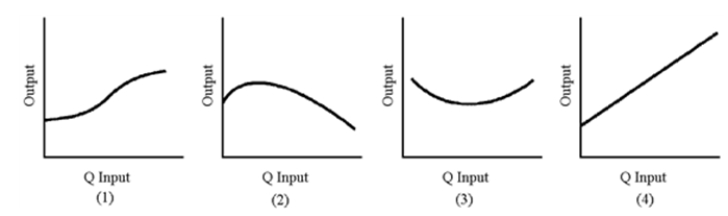
-Of the graphs in Figure 7-1, which best represents marginal physical product?
A) 1
B) 2
C) 3
D) 4
Correct Answer:

Verified
Correct Answer:
Verified
Related Questions
Q41: If the MPP of labor is 60
Q171: If MRP > P, a firm should
Q172: In the typical AC curve, the downward-sloping
Q173: If MPPa/Pa > MPPb/Pb, then the proportions
Q175: If a firm has increasing returns to
Q177: Figure 7-13 <img src="https://d2lvgg3v3hfg70.cloudfront.net/TB8592/.jpg" alt="Figure 7-13
Q178: A firm uses two inputs, A and
Q179: Table 7-6 <img src="https://d2lvgg3v3hfg70.cloudfront.net/TB8592/.jpg" alt="Table 7-6
Q180: A change in input prices will change
Q181: A Detroit business advertises, "The more we