Multiple Choice
Figure 7-1 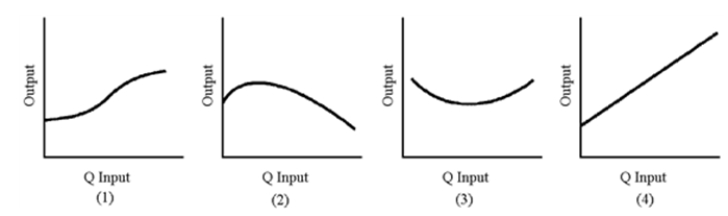
-.In Figure 7-1, which graph best represents total physical product with diminishing returns?
A) 1
B) 2
C) 3
D) 4
Correct Answer:

Verified
Correct Answer:
Verified
Related Questions
Q195: In the short run, if the average
Q196: John Amaker owns orange groves and hires
Q197: For most industries, average costs decrease indefinitely
Q198: Complete the table below by computing the
Q199: Which of the following will not lead
Q201: Table 7-1 <img src="https://d2lvgg3v3hfg70.cloudfront.net/TB8592/.jpg" alt="Table 7-1
Q202: The long-run average cost curve<br>A)is a composite
Q203: If the marginal physical product of more
Q204: Figure 7-4 <img src="https://d2lvgg3v3hfg70.cloudfront.net/TB8592/.jpg" alt="Figure 7-4
Q205: The amount of time during which at