Multiple Choice
Figure 7-8 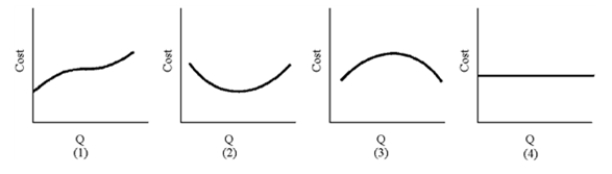
-Of the graphs in Figure 7-8, which diagram is most likely to be the marginal cost?
A) 1
B) 2
C) 3
D) 4
Correct Answer:

Verified
Correct Answer:
Verified
Related Questions
Q34: The expansion path of product indifference curves
Q35: Figure 7-7 <img src="https://d2lvgg3v3hfg70.cloudfront.net/TB8592/.jpg" alt="Figure 7-7
Q36: The rule for the optimal use of
Q37: John Amaker owns orange groves and hires
Q38: Figure 7-14 <img src="https://d2lvgg3v3hfg70.cloudfront.net/TB8592/.jpg" alt="Figure 7-14
Q40: When a firm's AC eventually starts to
Q41: If a firm is using optimal input
Q42: Figure 7-8 <img src="https://d2lvgg3v3hfg70.cloudfront.net/TB8592/.jpg" alt="Figure 7-8
Q43: Marginal revenue product is increasing as<br>A)the marginal
Q44: When marginal revenue product of an input