Multiple Choice
Figure 7-8 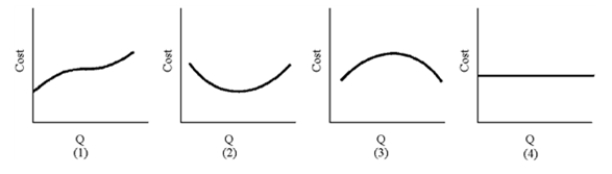
-Of the graphs in Figure 7-8, which represents fixed cost?
A) 1
B) 2
C) 3
D) 4
Correct Answer:

Verified
Correct Answer:
Verified
Related Questions
Q59: If the price of one input changes,
Q60: The average total cost curve of a
Q61: The rule that states that the marginal
Q62: Which of the following formulas defines average
Q63: The marginal revenue product of an hour
Q65: Figure 7-5 <img src="https://d2lvgg3v3hfg70.cloudfront.net/TB8592/.jpg" alt="Figure 7-5
Q66: A production indifference curve is sometimes called
Q67: In the long run, more costs become
Q68: Production indifference curves generally have a positive
Q69: In August 1988, the Los Angeles Kings