Multiple Choice
Figure 7-9 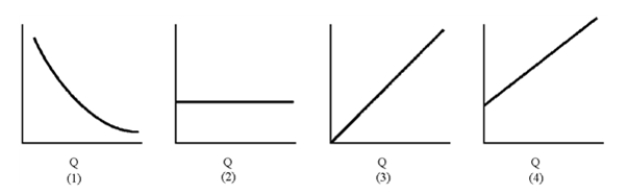
-Of the graphs in Figure 7-9, which represents total fixed cost?
A) 1
B) 2
C) 3
D) 4
Correct Answer:

Verified
Correct Answer:
Verified
Related Questions
Q102: A cost curve drawn with years on
Q103: In most businesses, there is only one
Q104: "Assuming the long-run average cost curve is
Q105: Which of the following is most likely
Q106: If the firm's marginal physical product is
Q108: A change in one input price will
Q109: Figure 7-13 <img src="https://d2lvgg3v3hfg70.cloudfront.net/TB8592/.jpg" alt="Figure 7-13
Q110: Table 7-4 <img src="https://d2lvgg3v3hfg70.cloudfront.net/TB8592/.jpg" alt="Table 7-4
Q111: If production indifference curves cross, this indicates
Q112: Table 7-5 <img src="https://d2lvgg3v3hfg70.cloudfront.net/TB8592/.jpg" alt="Table 7-5