Multiple Choice
Figure 7-9 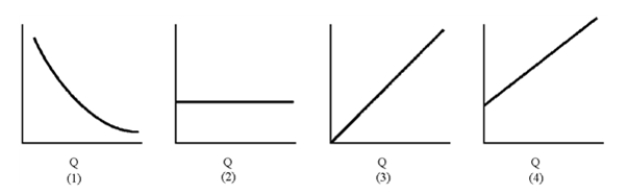
-Of the graphs in Figure 7-9, which represents average fixed cost?
A) 1
B) 2
C) 3
D) 4
Correct Answer:

Verified
Correct Answer:
Verified
Related Questions
Q178: A firm uses two inputs, A and
Q179: Table 7-6 <img src="https://d2lvgg3v3hfg70.cloudfront.net/TB8592/.jpg" alt="Table 7-6
Q180: A change in input prices will change
Q181: A Detroit business advertises, "The more we
Q182: Variable costs increase when output rises.
Q184: The short run is that period during
Q185: A firm is operating with an optimal
Q186: One reason why critics argue that large
Q187: Greg's Restaurant specializes in cheeseburger and produces
Q188: Table 7-4 <img src="https://d2lvgg3v3hfg70.cloudfront.net/TB8592/.jpg" alt="Table 7-4