Multiple Choice
Figure 7-10 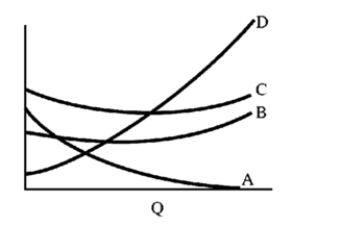
-In Figure 7-10, the curve B is
A) average fixed cost.
B) average total cost.
C) average variable cost.
D) marginal cost.
Correct Answer:

Verified
Correct Answer:
Verified
Related Questions
Q88: The firm can calculate all points on
Q89: Figure 7-4 <img src="https://d2lvgg3v3hfg70.cloudfront.net/TB8592/.jpg" alt="Figure 7-4
Q90: If the MRP per dollar is greater
Q91: Economies of scale lead to declining long-run
Q92: The average cost curve shows the total
Q94: Table 7-5 <img src="https://d2lvgg3v3hfg70.cloudfront.net/TB8592/.jpg" alt="Table 7-5
Q95: The table below gives data on output
Q96: "If it were not for the law
Q97: When economies of scale exist,<br>A)production costs per
Q98: A firm produces 2,000 high-quality bicycles per