Multiple Choice
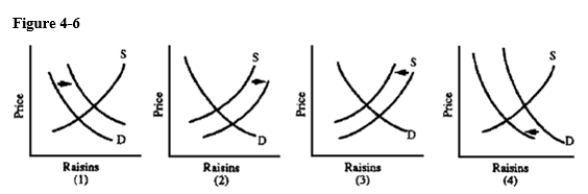
-Grapes can be used to produce wine or raisins.Which graph in Figure 4-6 best depicts the effects on the U.S.raisin market of a decline in purchases of domestic wine?
A) 1
B) 2
C) 3
D) 4
Correct Answer:

Verified
Correct Answer:
Verified
Related Questions
Q211: African governments wish to reduce the poaching
Q212: If supply increases, the equilibrium price will
Q213: <img src="https://d2lvgg3v3hfg70.cloudfront.net/TB8592/.jpg" alt=" -On a traditional
Q214: Why do airlines tend to lower ticket
Q215: When the price per ticket is P*,
Q217: The quantity of goods exchanged in a
Q218: An increase in the price of poultry
Q219: A common misconception about supply is that<br>A)supply
Q220: If orange juice prices double next year,
Q221: Price controls date back to<br>A)World War II.<br>B)the