Essay
The following graph shows the relationship between a large country
importer of a good, say steel, and its tariff rate (in percentages).Explain
why the curve reaches maximum and then declines. 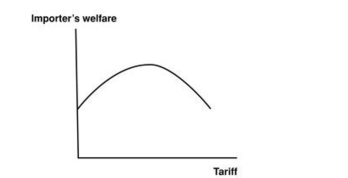
Correct Answer:

Verified
The curve rises whenever the termsoftr...View Answer
Unlock this answer now
Get Access to more Verified Answers free of charge
Correct Answer:
Verified
View Answer
Unlock this answer now
Get Access to more Verified Answers free of charge
Q24: WTO is the acronym for:<br>A) the World
Q84: Figure: Home Market I <img src="https://d2lvgg3v3hfg70.cloudfront.net/TB7261/.jpg" alt="Figure:
Q85: How many units will a country import
Q86: Under the GATT framework, nations negotiated for
Q87: To help its domestic producers, the United
Q90: <img src="https://d2lvgg3v3hfg70.cloudfront.net/TB7261/.jpg" alt=" (Scenario: Guatemala's Television
Q91: When a tariff is imposed, there is
Q92: <img src="https://d2lvgg3v3hfg70.cloudfront.net/TB7261/.jpg" alt=" (Scenario:
Q93: Which of the following is an exception
Q173: Why did no U.S. tire producer support