Multiple Choice
The plots shown here are normal probability plots for random samples of 65 healthy male and 65 healthy female body temperatures. 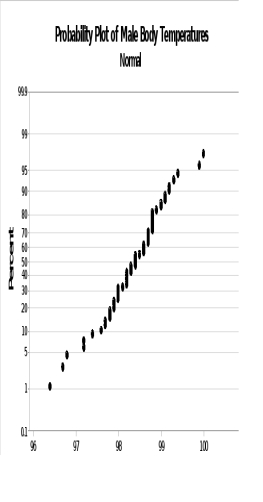
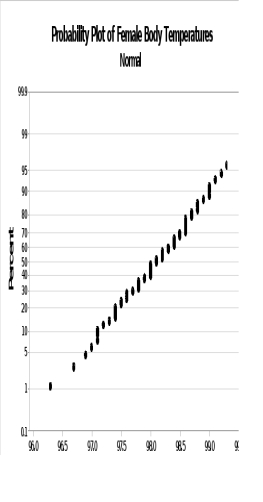 Which group is more likely to be normally distributed?
A) The males are more likely to be normal because their plot does not appear to be a straight line.
B) The females are more likely to be normal because their plot does not appear to be a straight line.
C) The females are more likely to be normal because their plot does appear to be a straight line.
D) The two groups appear to be equally normally distributed.
Correct Answer:

Verified
Correct Answer:
Verified
Q19: Any distribution whose mean value is equal
Q20: What differentiates the standard normal distribution (Z)
Q21: Let X = the time (in minutes)
Q22: The amount of time a person waits
Q23: Although the binomial distribution is discrete, in
Q25: Let X = the time (in minutes)
Q26: The maximum value for any cumulative probability
Q27: Quality control engineers create acceptable boundaries for
Q28: X follows a normal distribution with a
Q29: The higher the peak of a normal