Multiple Choice
A researcher wants to know if students who do not plan to apply for financial aid have more variability on the SAT math test than those who do.Random samples of 25 students who do not plan to apply for aid (sample 1) as well as 30 who do (sample 2) are summarized below: 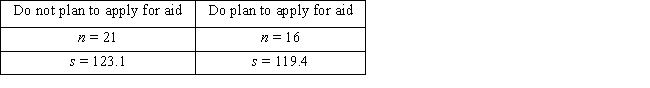
Does it appear that students who do not plan to apply for financial aid are less consistent on the SAT math test than those who do plan to apply for aid? Select the appropriate critical value (CV) , test statistic (TS) , and decision and state the alternative hypothesis.(Use α = 0.01) .
A) CV = 3.37; TS = 1.0310; fail to reject H₀;  states that students who do not apply for aid have scores that vary just as much as those who do apply for aid.
B) CV = 3.37; TS = 1.0629; fail to reject H₀;  states that students who do not apply for aid have more variable scores than those who do apply for aid.
C) CV = 0.2967; TS = 1.0310; reject H₀;  states that students who do not apply for aid have scores that vary just as much as those who do apply for aid.
D) CV = -3.26; TS = -1.0154; reject H₀;  states that students who do not apply for aid have scores that vary just as much as those who do apply for aid.
Correct Answer:

Verified
Correct Answer:
Verified
Q14: Suppose you want to use a paired
Q15: In 1993, Toyota introduced the Supra sports
Q16: If you wish to estimate the difference
Q17: Hypothesis testing on two means from dependent
Q18: Concerning the statement of the null hypothesis,
Q20: In developing a confidence interval estimate for
Q21: When you are testing whether two population
Q22: Concerning inference on two independent population means,
Q23: Which of the following is NOT a
Q24: Which of the following options would serve