Multiple Choice
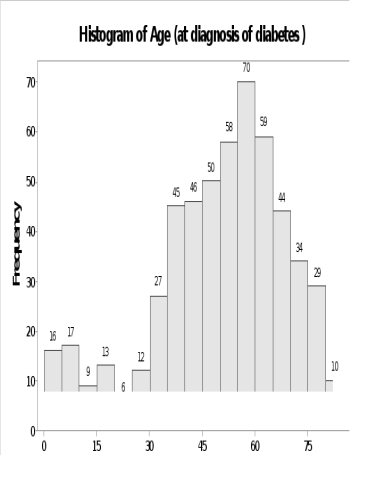 This histogram shows the age at which 548 patients were first diagnosed with diabetes.The shape of this histogram is best described as:
A) symmetric.
B) bimodal.
C) monomodal.
D) positively skewed.
Correct Answer:

Verified
Correct Answer:
Verified
Related Questions
Q14: A numeric data set is _ if
Q15: Concerning qualitative data, the _ of a
Q16: If there are more than two observations
Q17: <img src="https://d2lvgg3v3hfg70.cloudfront.net/TB8195/.jpg" alt=" What data value
Q18: A numerical data set is _ if
Q20: Concerning qualitative data, the _ of a
Q21: The sum of all the relative frequencies
Q22: Concerning univariate data, a _ or _
Q23: To assure prompt service, the city metro
Q24: A distribution with only one peak is