Multiple Choice
TABLE 2-16
The figure below is the percentage polygon for the amount of calories for a sample of 36 pizzas products where the upper limits of the intervals are: 310, 340, 370, 400 and 430.
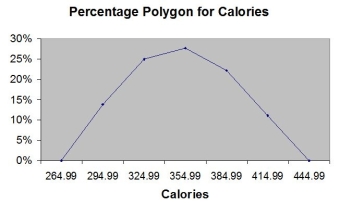
-Referring to Table 2-16, roughly what percentage of pizza products contain between 400 and 430 calories?
A) 0%
B) 11%
C) 89%
D) 100%
Correct Answer:

Verified
Correct Answer:
Verified
Q5: TABLE 2-10<br>The histogram below represents scores achieved
Q42: A good choice for the number of
Q50: TABLE 2-13<br>Given below is the stem-and-leaf display
Q86: The percentage polygon is formed by having
Q91: TABLE 2-10<br>The histogram below represents scores achieved
Q127: TABLE 2-13<br>Given below is the stem-and-leaf display
Q147: TABLE 2-16<br>The figure below is the percentage
Q148: You have collected data on the responses
Q151: In a survey, 150 executives were asked
Q153: Data on 1,500 students' height were collected