True/False
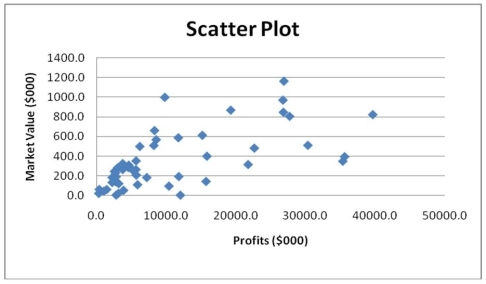
Given below is the scatter plot of the market value (thousands$)and profit (thousands$)of 50 U.S. companies. Higher market values appear to be associated with higher profits.
Correct Answer:

Verified
Correct Answer:
Verified
Related Questions
Q29: Which of the four methods of data
Q30: Given below is the scatter plot of
Q30: TABLE 2-14<br>The table below contains the number
Q36: Apple Computer, Inc. collected information on the
Q38: Which of the following is appropriate for
Q60: The original data values cannot be determined
Q74: TABLE 2-13<br>Given below is the stem-and-leaf display
Q90: In constructing a polygon,each class grouping is
Q203: TABLE 2-14<br>The table below contains the number
Q210: TABLE 2-9<br>The frequency distribution below represents the