menu-iconExamlexExamLexServices

Discover

Ask a Question
  1. All Topics
  2. Topic
    Statistics
  3. Study Set
    Business Statistics
  4. Exam
    Exam 2: Organizing and Visualizing Data
  5. Question
    Given Below Is the Scatter Plot of the Market Value
Solved

Given Below Is the Scatter Plot of the Market Value

Question 63

Question 63

True/False

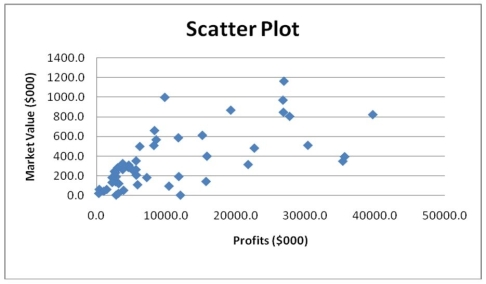
Given below is the scatter plot of the market value (thousands$)and profit (thousands$)of 50 U.S. companies. There appears to be a negative relationship between market value and profit.

Correct Answer:

verifed

Verified

Unlock this answer now
Get Access to more Verified Answers free of charge

Related Questions

Q31: TABLE 2-5<br>The following are the duration in

Q58: You have collected data on the approximate

Q67: You have collected information on the consumption

Q78: A_ is a summary table in which

Q80: SCENARIO 2-1<br>An insurance company evaluates many numerical

Q110: TABLE 2-3<br>Every spring semester, the School of

Q124: TABLE 2-12<br>The table below contains the opinions

Q129: TABLE 2-12<br>The table below contains the opinions

Q156: TABLE 2-8<br>The Stem-and-Leaf display represents the number

Q190: TABLE 2-12<br>The table below contains the opinions

Examlex

ExamLex

About UsContact UsPerks CenterHomeschoolingTest Prep

Work With Us

Campus RepresentativeInfluencers

Links

FaqPricingChrome Extension

Download The App

Get App StoreGet Google Play

Policies

Privacy PolicyTerms of ServiceHonor CodeCommunity Guidelines

Scan To Download

qr-code

Copyright © (2025) ExamLex LLC.

Privacy PolicyTerms Of ServiceHonor CodeCommunity Guidelines