True/False
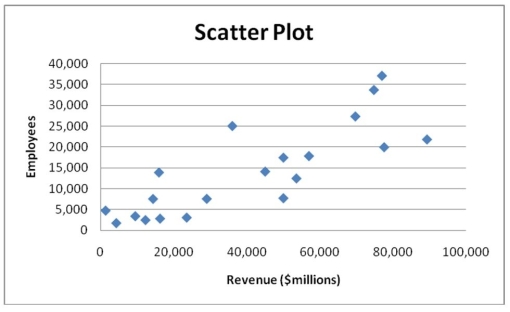
Given below is the scatter plot of the number of employees and the total revenue ($millions)of 20 U.S. companies. There appears to be a positive relationship between total revenue and the number of employees.
Correct Answer:

Verified
Correct Answer:
Verified
Q10: In graphing two categorical data,the side-by-side bar
Q10: TABLE 2-7<br>The Stem-and-Leaf display below contains data
Q17: TABLE 2-14<br>The table below contains the number
Q40: TABLE 2-11<br>The ordered array below resulted from
Q62: TABLE 2-13<br>Given below is the stem-and-leaf display
Q71: TABLE 2-11<br>The ordered array below resulted from
Q118: A histogram can have gaps between the
Q128: TABLE 2-10<br>The histogram below represents scores achieved
Q149: Relationships in a contingency table can be
Q158: Histograms are used for numerical data while