Multiple Choice
TABLE 3-11
Given below are the rating and performance scores of 15 laptop computers.
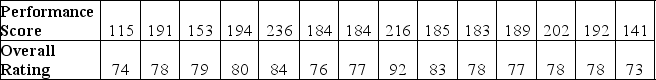
-Referring to Table 3-11, how will you classify the linear relationship between the performance scores and the rating?
A) weak
B) moderate
C) strong
D) no relationship
Correct Answer:

Verified
Correct Answer:
Verified
Q9: TABLE 3-2<br>The data below represent the amount
Q26: TABLE 3-12<br>Energy drink consumption has continued to
Q28: TABLE 3-3<br>The ordered array below represents the
Q33: The interquartile range is a measure of
Q47: In general,which of the following descriptive summary
Q79: In a set of numerical data, the
Q97: TABLE 3-6<br>The rates of return of an
Q98: TABLE 3-7<br>In a recent academic year, many
Q112: TABLE 3-3<br>The ordered array below represents the
Q147: When extreme values are present in a