Multiple Choice
TABLE 10-9
The following Excel output contains the results of a test to determine whether the proportions of satisfied customers at two resorts are the same or different.
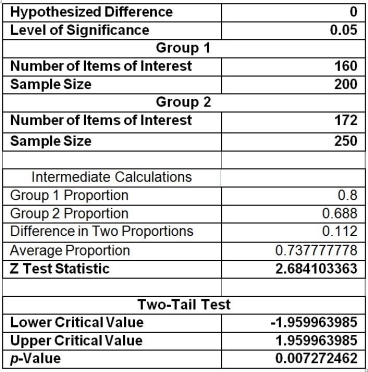
-Referring to Table 10-9, if you want to test the claim that "Resort 1 (Group 1) has a higher proportion of satisfied customers compared to Resort 2 (Group 2) ", the p-value of the test will be
A) 0.007272.
B) 0.00727/2.
C) 2 * (0.00727) .
D) 1 - (0.00727/2) .
Correct Answer:

Verified
Correct Answer:
Verified
Q13: The statistical distribution used for testing the
Q18: F tests are one-tail tests.
Q136: A Marine drill instructor recorded the time
Q184: TABLE 10-8<br>A few years ago, Pepsi invited
Q186: TABLE 10-10<br>A corporation randomly selects 150 salespeople
Q187: TABLE 10-5<br>To test the effectiveness of a
Q190: A powerful women's group has claimed that
Q191: TABLE 10-15<br>The table below presents the summary
Q193: TABLE 10-3<br>A real estate company is interested
Q194: TABLE 10-14<br>The use of preservatives by food