Multiple Choice
TABLE 10-9
The following Excel output contains the results of a test to determine whether the proportions of satisfied customers at two resorts are the same or different.
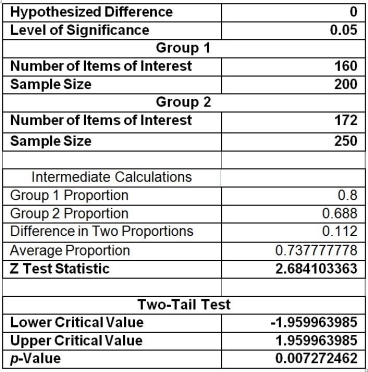
-Referring to Table 10-9, if you want to test the claim that "Resort 1 (Group 1) has a lower proportion of satisfied customers compared to Resort 2 (Group 2) ," you will use
A) a t test for the difference between two proportions.
B) a Z test for the difference between two proportions.
C) an F test for the difference between two proportions.
D) an F test for the ratio of two variances.
Correct Answer:

Verified
Correct Answer:
Verified
Q112: When testing H₀: π₁ - π₂ =
Q112: When testing H₀: π₁ - π₂ =
Q113: TABLE 10-1<br>Are Japanese managers more motivated than
Q114: TABLE 10-7<br>A buyer for a manufacturing plant
Q115: TABLE 10-3<br>A real estate company is interested
Q117: TABLE 10-15<br>The table below presents the summary
Q118: TABLE 10-4<br>Two samples each of size 25
Q119: TABLE 10-15<br>The table below presents the summary
Q120: If you wish to determine whether there
Q121: TABLE 10-6<br>To investigate the efficacy of a