Short Answer
TABLE 10-9
The following Excel output contains the results of a test to determine whether the proportions of satisfied customers at two resorts are the same or different.
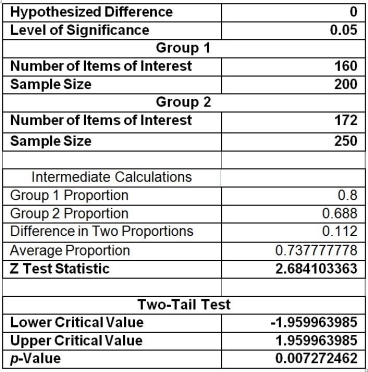
-Referring to Table 10-9, construct a 99% confidence interval estimate of the difference in the population proportion of satisfied customers between the two resorts.
Correct Answer:

Verified
Correct Answer:
Verified
Q138: If we are testing for the difference
Q139: TABLE 10-7<br>A buyer for a manufacturing plant
Q140: TABLE 10-8<br>A few years ago, Pepsi invited
Q141: TABLE 10-15<br>The table below presents the summary
Q142: TABLE 10-13<br>The amount of time required to
Q144: TABLE 10-7<br>A buyer for a manufacturing plant
Q145: TABLE 10-10<br>A corporation randomly selects 150 salespeople
Q148: TABLE 10-15<br>The table below presents the summary
Q161: The F distribution is symmetric.
Q170: A researcher is curious about the effect