Multiple Choice
TABLE 10-17
A realtor wants to compare the mean sales-to-appraisal ratios of residential properties sold in four neighborhoods (A, B, C, and D) . Four properties are randomly selected from each neighborhood and the ratios recorded for each, as shown below.
A: 1.2, 1.1, 0.9, 0.4 C: 1.0, 1.5, 1.1, 1.3
B: 2.5, 2.1, 1.9, 1.6 D: 0.8, 1.3, 1.1, 0.7
Interpret the results of the analysis summarized in the following table:
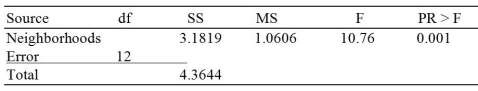
-Referring to Table 10-17,
A) at the 0.05 level of significance, the mean ratios for the four neighborhoods are not all the same.
B) at the 0.01 level of significance, the mean ratios for the four neighborhoods are all the same.
C) at the 0.10 level of significance, the mean ratios for the four neighborhoods are not significantly different.
D) at the 0.05 level of significance, the mean ratios for the four neighborhoods are not significantly different from 0.
Correct Answer:

Verified
Correct Answer:
Verified
Q8: In testing for the differences between the
Q38: TABLE 10-20<br>A hotel chain has identically sized
Q43: TABLE 10-19<br>An agronomist wants to compare the
Q46: TABLE 10-18<br>As part of an evaluation program,
Q62: TABLE 10-11<br>The dean of a college is
Q112: When testing H₀: π₁ - π₂ =
Q141: TABLE 10-15<br>The table below presents the summary
Q159: A completely randomized design<br>A)has only one factor
Q170: TABLE 10-2<br>A researcher randomly sampled 30 graduates
Q186: TABLE 10-10<br>A corporation randomly selects 150 salespeople