Multiple Choice
TABLE 10-17
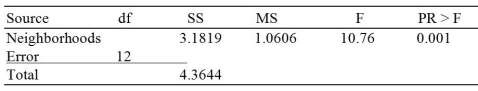
A realtor wants to compare the mean sales-to-appraisal ratios of residential properties sold in four neighborhoods (A, B, C, and D) . Four properties are randomly selected from each neighborhood and the ratios recorded for each, as shown below.
A: 1.2, 1.1, 0.9, 0.4 C: 1.0, 1.5, 1.1, 1.3
B: 2.5, 2.1, 1.9, 1.6 D: 0.8, 1.3, 1.1, 0.7
Interpret the results of the analysis summarized in the following table:
-Referring to Table 10-17, the null hypothesis for Levene's test for homogeneity of variances is
A) H₀: μA = μB = μC = μD.
B) H₀: MA = MB = MC = MD.
C) H₀: σA² = σB² = σC² = σD².
D) H₀: πA = πB = πC = πD.
Correct Answer:

Verified
Correct Answer:
Verified
Q82: TABLE 10-3<br>A real estate company is interested
Q83: TABLE 10-12<br>A quality control engineer is in
Q87: The F test in a completely randomized
Q180: When the F test is used for
Q181: TABLE 10-4<br>Two samples each of size 25
Q218: TABLE 10-19<br>An agronomist wants to compare the
Q219: TABLE 10-13<br>The amount of time required to
Q224: An airline wants to select a computer
Q225: TABLE 10-19<br>An agronomist wants to compare the
Q226: The Wall Street Journal recently ran an